

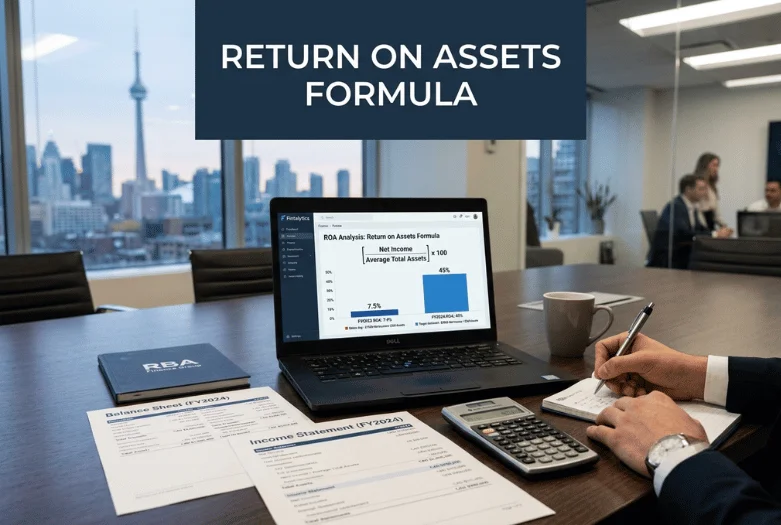
Two Canadian firms each reported net income of 180,000 CAD last year. One shows a return on assets of 45%, the other 7.5%. The second is the stronger business. That gap is the reason the return on assets formula misleads so many owners who run it correctly.
Quick answer: ROA is net income divided by average total assets, multiplied by 100. A firm earning 180,000 CAD on average total assets of 2,400,000 CAD scores 7.5%. The ratio only carries meaning against firms that must own a similar amount of equipment, stock, and property, so never compare it across industries.
Same profit, three asset bases, three very different ratios
| Business | Net Income (CAD) | Average Total Assets (CAD) | Return on Assets Formula Result |
| Design studio that leases its room | 180,000 | 400,000 | 45% |
| Courier firm with a 12-van fleet | 180,000 | 1,500,000 | 12% |
| Bakery that owns its premises | 180,000 | 2,400,000 | 7.5% |
Key takeaways
- ROA = net income ÷ average total assets × 100.
- Asset intensity, not skill, drives most of the difference between two firms’ ratios.
- Split ROA into net profit margin and asset turnover to see which half is weak.
- Compare only against your own industry line, never the all-industry total.
- Leasing, old equipment, seasonality and one-off gains all bend the number.
What the return on assets formula actually measures
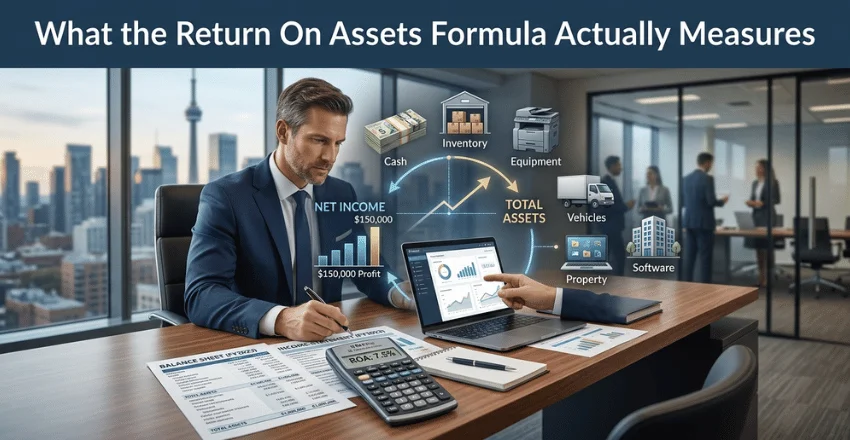
Return on Assets Formula answers one plain question: for every 100 CAD of things the business controls, how much profit came out the other end? ROA puts net income on top. It is the bottom line from the income statement, the profit left once every operating cost, depreciation, and financing charge has been paid.
Total assets go underneath, covering the whole left side of the balance sheet: cash, receivables, stock, equipment, vehicles, premises, and software. In other words, the Return On Assets Formula shows how effectively a business turns the assets it controls into profit. Both numbers come straight off the statements. Nothing is estimated.
Two versions of the denominator circulate. They do not give the same answer.
- Average total assets. Add the opening and closing balances, then halve the result. Use this for a full financial year, because the asset base moves during the year.
- Closing total assets. Take the figure at the balance sheet date. Faster, and good enough for a single snapshot or a quick sanity check.
Our bakery opened its year on 2,300,000 CAD of assets and closed on 2,500,000 CAD. Average total assets came to 2,400,000 CAD. Closing assets produced 7.2%; the average produced 7.5%. Small, yes. It still moves the answer, and mixing the two versions across years is how owners convince themselves of a trend that is not there.
A worked example with real numbers
Kettle Ridge Bakery owns its building, two ovens, and a delivery van. Nadeau Design Studio leases one room and owns three laptops. Both firms earned 180,000 CAD.
Here is the bakery, step by step:
- Take net income from the income statement: 180,000 CAD.
- Take opening and closing total assets from the two balance sheets: 2,300,000 CAD and 2,500,000 CAD.
- Average them: 2,400,000 CAD.
- Divide: 180,000 ÷ 2,400,000 = 0.075.
- Multiply by 100: an ROA of 7.5%.
Now run the same five steps for the studio. Its average total assets came to 400,000 CAD, so 180,000 divided by 400,000 gives 45%.
Nothing separates those two results except what each firm had to buy to open its doors. The bakery is not six times worse at business. Owning an oven is the whole difference. If the balance sheet side of this is new to you, our small business ownership guides cover where each of these figures comes from.
Why the same ROA means two different things in two industries
Asset intensity is rarely a management decision. Mostly it is the price of entry.
A grocer carries stock and refrigeration. Vans are the courier firm’s whole asset base. Laptops and a lease are the studio’s. None of those owners picked an asset base from a menu, and no formula can undo the difference.
So 7.5% inside an asset-heavy trade can sit near the top of its peer group. In a business that owns almost nothing, 45% can be thoroughly ordinary. Judge the ratio against firms facing the same entry cost as you.
Canadian owners have a free reference point for this. Statistics Canada publishes a quarterly return on assets figure by non-financial industry. It comes from the agency’s survey of enterprise financial statements, with the balance sheet and income statement aggregates published beside it. Find your own industry line in that series. The all-industry total blends a pipeline operator with a consultancy, so it tells you nothing.
Split ROA into margin and asset turnover
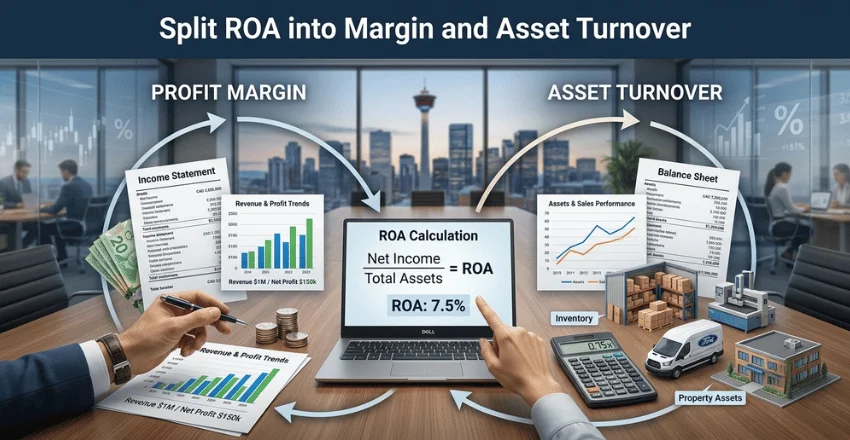
A single ratio names a problem without locating it. Two components fix that, because ROA is net profit margin multiplied by asset turnover.
The same two firms, broken into their two halves.
| Kettle Ridge Bakery | 1,800,000 | 10% | 0.75 | 7.5% |
| Nadeau Design Studio | 900,000 | 20% | 2.25 | 45% |
Read across the bakery’s row. Its margin is respectable at 10%, so pricing is not the issue. Its asset turnover of 0.75 says each 1 CAD of assets generates only 0.75 CAD of revenue, and that is where the ratio is lost.
That split turns a vague number into a diagnosis. Weak margin means a pricing or cost problem. Weak turnover means idle stock, empty capacity, or property you are not using hard enough. Stock is the usual culprit for retailers, and our online retail and inventory guides go through stock-holding in more detail.
Four things that quietly bend the ratio
Before you act on an ROA, check whether one of these is doing the talking.
- Leasing versus owning. Many private Canadian firms reporting under ASPE keep operating leases off the balance sheet. Leasing premises instead of owning them shrinks total assets and inflates the ratio, without changing how the business runs.
- Old equipment. Depreciation grinds book values down every year. A plant bought two decades ago shows a small asset base and a flattering ratio, right up to the year it has to be replaced.
- Seasonality. A quarterly figure distorts the picture for a Canadian retailer, whose stock peaks in November and whose profit lands in December. Use full financial years.
- One-off gains. Selling a building lifts net income once. Strip that out before comparing this year with last, or you will read a windfall as an improvement.
ROA compared with return on equity
Return on equity divides the same net income by the owners’ stake rather than by total assets. Equity is smaller than assets whenever a firm has borrowings, so ROE always comes out higher.
That difference matters more than it looks. An owner can lift ROE by borrowing more and buying back shares, without the business becoming any better at what it does. ROA refuses to be flattered that way. A bank or a prospective buyer will usually check both. The gap between the two shows how much of the return rides on borrowed money.
How to raise a low ROA
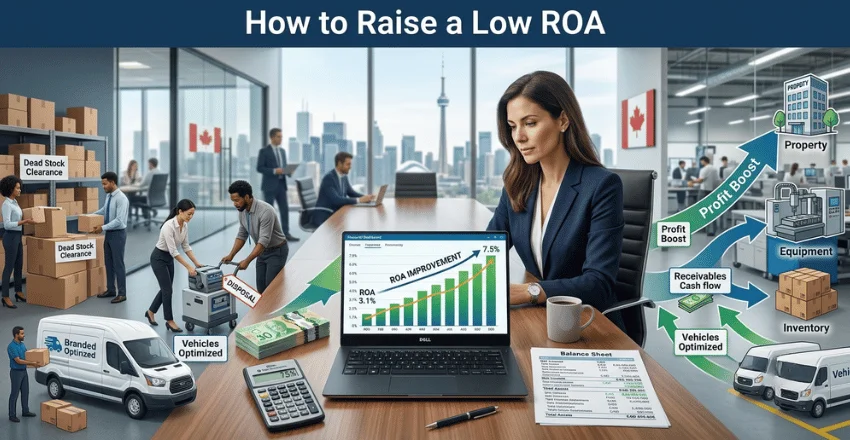
There are two levers, and only two. Earn more from the same asset base, or carry fewer assets for the same earnings.
Practical moves that shift the ratio within a year:
- Clear dead stock, even at a loss, so it stops sitting in total assets.
- Chase receivables harder; unpaid bills are assets earning nothing.
- Sublet or give up space you no longer fill.
- Raise prices before cutting costs, because margin feeds the ratio directly.
- Sell equipment that runs below half capacity and rent it when you need it.
Track the ratio yearly, not monthly. Ratios like this move slowly, and monthly noise will only tempt you into bad decisions. More explainers in the Bizverra journal work through the other statements these figures sit in.
Your next step
Pull your last two balance sheets and your income statement, and run the five steps above. Then find your own industry line in the Statistics Canada series and see where you actually sit.
Apart from that, if you want to know more about What Is an SOP? then visit our B2B category.
FAQ
Net income divided by average total assets, multiplied by 100. Average total assets is the opening balance plus the closing balance, divided by 2.
There is no universal figure. In asset-heavy trades such as manufacturing or transport, mid single digits can be strong. In service businesses that own little, 20% and up is common and unremarkable. Your industry line is the only fair yardstick.
No. A high ratio sometimes means the firm has under-invested in equipment for years and is running assets past their useful life. Check the age of the asset base before you celebrate.
Yes. A loss-making year produces a negative net income and therefore a negative ratio. It tells you the size of the loss relative to what the business owns.
Use the average for annual comparisons, and stay consistent. Switching between the two across years creates a trend that does not exist.