

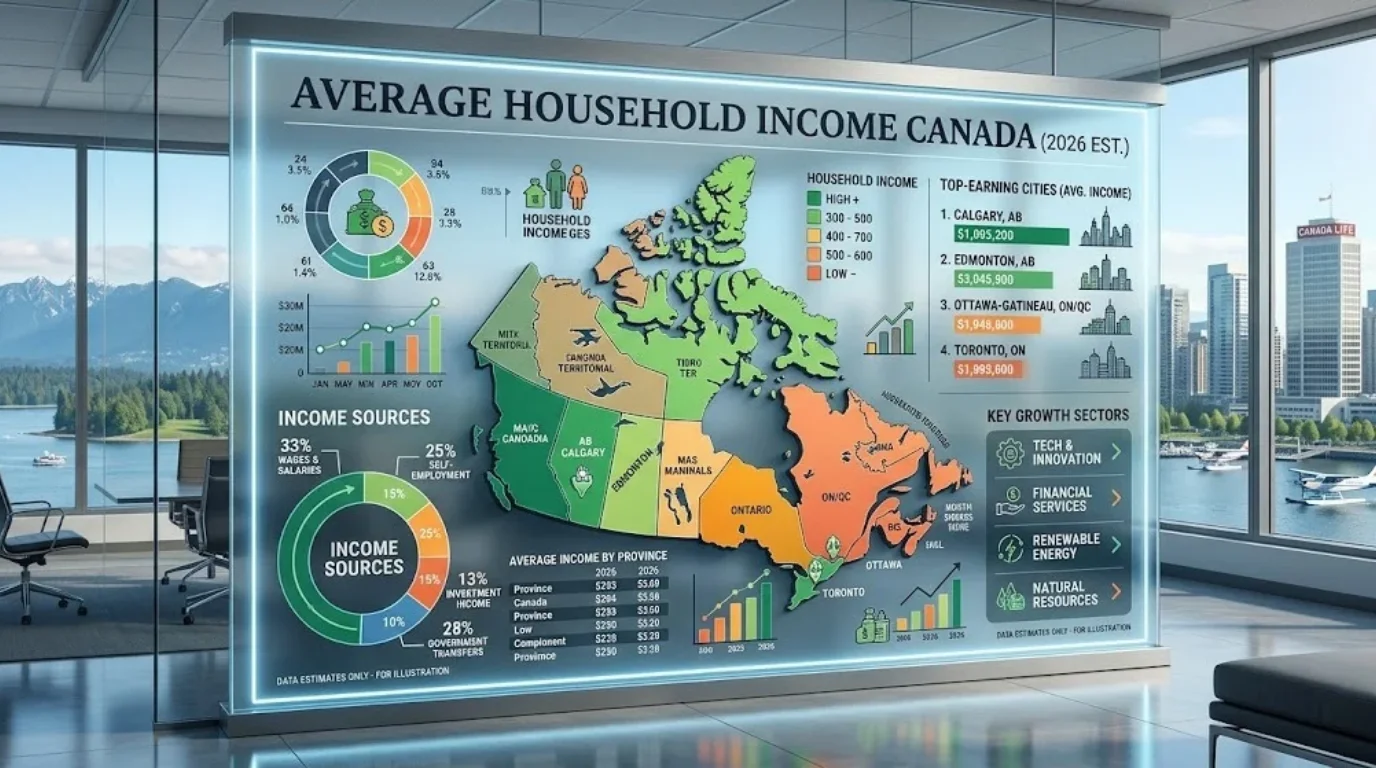
Canadians searching average household income Canada can encounter several different numbers. That happens because government datasets measure income in different ways. The clearest answer depends on whether you mean average, median, before-tax, or disposable income.
Quick answer: Canadian households had an average disposable income of about $104,430 in 2025, according to Statistics Canada. The 2024 median after-tax income was $75,500 across families and unattached individuals. Economic families alone had a much higher median after-tax income of $108,900.
Canadian Household Income at a Glance
| Income measure | Latest figure | Reference year | What it measures |
|---|---|---|---|
| Average disposable income per household | $104,430 | 2025 | Average household income available after taxes and transfers |
| Median after-tax income, families and unattached individuals | $75,500 | 2024 | Midpoint across families and people living independently |
| Median after-tax income, economic families | $108,900 | 2024 | Midpoint for families with two or more related people |
| Median after-tax income, unattached individuals | $41,000 | 2024 | Midpoint for people outside an economic family |
| Average after-tax income, census families and persons outside families | $82,610 | 2023 | Arithmetic average using tax-filer family data |
Statistics Canada publishes each figure for a different analytical purpose. Consequently, none should automatically replace the others. The measure you choose should match the comparison you want to make.
Key Takeaways
- Average household disposable income reached approximately $104,430 in 2025.
- Median after-tax income was $75,500 in 2024 across families and unattached individuals.
- Economic families recorded a median after-tax income of $108,900.
- Alberta had the highest provincial median at $85,300 using the broader Statistics Canada measure.
- Ontario followed at $79,500.
- Household size can change the income benchmark dramatically.
- Median income usually provides a better picture of a typical household than an average.
What Is the Average Household Income Canada Figure in 2026?
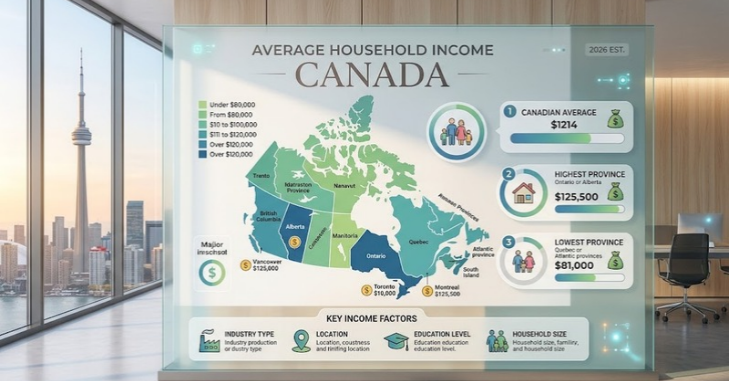
The newest Statistics Canada distributional data puts average household disposable income at $104,430 for 2025. That figure increased from $100,615 in 2024. The year-over-year increase was about 3.8%.
Disposable income represents money available after accounting for taxes and transfers within the national accounts framework. It is useful for understanding household purchasing power. Still, it should not be confused with gross salary or employment income.
Another Statistics Canada dataset reported an average after-tax family income of $82,610 for 2023. That series covers census families and people outside census families. Its definitions differ from the household disposable-income accounts.
This difference explains why online articles can quote figures ranging from roughly $80,000 to more than $100,000. Those figures may all come from legitimate datasets. Problems arise when an article fails to explain what each number measures.
Average Income Versus Median Income
An average adds all incomes together and divides the result by the number of households. High-income households can pull that figure upward. A median identifies the household exactly in the middle.
For that reason, the median usually gives a clearer picture of a typical Canadian household. Statistics Canada reported a $75,500 median after-tax income for families and unattached individuals in 2024, according to its Canadian Income Survey, 2024. The figure was relatively unchanged after adjusting for inflation.
The difference becomes even clearer when household types are separated. Economic families had a median after-tax income of $108,900 in 2024. Unattached individuals had a median of only $41,000.
Someone living alone should therefore avoid comparing personal finances with a two-income family benchmark. Family size changes both earning capacity and expenses. A useful comparison starts with households that resemble your own.
Household Income by Province
Income varies considerably across Canada. Statistics Canada reported Alberta and Ontario as the highest-income provinces in its 2024 median after-tax data. Regional differences do not account for local living costs.
| Province or territory | Median after-tax income, 2024 |
|---|---|
| Northwest Territories | $116,100 |
| Nunavut | $109,600 |
| Yukon | $89,300 |
| Alberta | $85,300 |
| Ontario | $79,500 |
| British Columbia | $75,800 |
| Saskatchewan | $75,500 |
| Canada | $75,500 |
| Manitoba | $72,000 |
| Quebec | $68,800 |
| Newfoundland and Labrador | $68,000 |
| Prince Edward Island | $65,900 |
| New Brunswick | $65,100 |
| Nova Scotia | $64,200 |
The territories recorded the highest figures overall, led by the Northwest Territories at $116,100. Northern living costs are also substantially different from provincial costs. Statistics Canada specifically cautions against treating income differences as cost-of-living rankings.
Alberta led the provinces at $85,300. Ontario followed at $79,500, while several Atlantic provinces remained below the national midpoint. These differences reflect labour markets, demographics, industries, and other regional factors.
Why Household Size Changes the Numbers
Household composition can matter as much as geography. A two-earner couple can combine salaries while sharing housing and utility expenses. A person living alone must cover many fixed costs with one income.
In 2024, median after-tax income for non-senior Canadian families reached $118,400. Senior families recorded $83,200. Families and unattached individuals therefore need separate benchmarks for meaningful comparisons.
Couples with children also experienced stronger income growth during 2024. Statistics Canada reported a 3.6% increase in their median after-tax income. Couples without children or other relatives recorded a smaller 1.9% increase.
These differences show why a single national figure has limited value. Your household type should come before the headline number. Then location and living costs can refine the comparison.
Why Gross Income and Take-Home Income Differ
Gross income is not the money that reaches your bank account. Employees usually have income tax, CPP contributions, and Employment Insurance premiums deducted. Workplace benefits or pension contributions may reduce net pay further.
Bizverra’s guide to Canadian paycheque deductions explains these deductions and current payroll limits in detail. It also shows why salary and deposited pay differ. That distinction matters when comparing household earnings with after-tax statistics.
Two households earning identical gross salaries can have different disposable income. Provincial taxes, benefits, deductions, and family circumstances all affect the result. Debt payments then determine how much income remains available for saving.
Does a Higher Household Income Mean You Are Better Off?
A higher income gives a household more financial capacity, but income alone cannot measure financial health. Housing costs can consume much more income in one city than another. Childcare, transportation, debt, and family size also affect affordability.
Statistics Canada does not adjust its provincial income figures for regional living costs. This limitation matters when comparing Alberta, Ontario, Atlantic Canada, and the territories. A higher nominal income may accompany higher unavoidable expenses.
Inflation also changes what the same dollar amount can buy over time. Bizverra’s Canadian inflation guide can help readers understand how price changes affect purchasing power. Comparing incomes in constant dollars provides a better historical view.
What Is Considered a Good Household Income in Canada?
There is no national salary that automatically qualifies as a good household income. A practical benchmark is the median for your household type and region. You should then compare that income against your actual essential expenses.
For an economic family, $108,900 after tax represented the 2024 median. Income above that level exceeds the midpoint for Canadian economic families. That does not guarantee financial comfort in every community.
For someone living outside an economic family, the relevant median was $41,000. Comparing that person with a multi-earner family would distort the result. Housing needs and dependants should also shape any personal benchmark.
A stronger test is whether income covers necessities while leaving room for emergencies and long-term goals. Savings capacity matters more than a national ranking. Sustainable finances also depend on spending and debt management.
How Canadians Can Improve Household Cash Flow
Increasing employment income is only one way to improve household finances. Reducing expensive debt can produce meaningful savings. Reviewing recurring expenses can also free cash without increasing salary.
Households with suitable resources may consider additional earnings outside their primary employment. Bizverra’s guide to passive income ideas in Canada discusses interest, investments, rentals, and digital businesses. Each option carries different costs, risks, and tax treatment.
Borrowing should receive similar scrutiny because interest reduces available household income. Bizverra’s Canadian line of credit guide explains how revolving borrowing works. Understanding borrowing costs can help prevent income gains from disappearing into interest charges.
The goal should not be reaching one impressive income number. A household needs enough reliable cash flow to support its obligations. Consistent savings then create greater financial flexibility over time.
The Bottom Line
Canadian income statistics make more sense when the measurement is clearly identified. Average disposable income reached $104,430 per household in 2025. The broader median after-tax benchmark was $75,500 in 2024.
Economic families recorded a much higher median of $ 108,900. People living outside families had a $41,000 median instead. Those differences make household type essential for a useful comparison.
Use national income figures as benchmarks rather than personal financial targets. Compare households with similar sizes, locations, and tax circumstances. Then measure whether your income supports expenses, savings, and future goals.
Frequently Asked Questions
What is the average household income Canada households earn?
The newest official household disposable-income data shows an average of $104,430 per household in 2025. This measure comes from Statistics Canada’s distributional household accounts. Other datasets can produce different averages because their definitions differ.
What is the median household income in Canada?
Statistics Canada reported a median after-tax income of $75,500 for families and unattached individuals in 2024. Economic families alone had a median of $108,900. The difference shows why household definitions matter.
Which province has the highest household income?
Alberta had the highest provincial median after-tax income in 2024 at $85,300. Ontario ranked second at $79,500. The Northwest Territories led all provinces and territories at $116,100.
Is $100,000 a good household income in Canada?
A $100,000 household income is above some national benchmarks and below others. Its purchasing power depends heavily on taxes, family size, housing, and location. Compare after-tax income with similar households instead of using one national threshold.
Is average or median income more useful?
Median income is usually better for understanding what a typical household earns. Extremely high earners can raise the mathematical average. The average remains useful when measuring total income across the economy.
Why do Canadian household income statistics disagree?
Different datasets measure different populations, years, and income concepts. Some report gross income, while others measure after-tax or disposable income. Always check the definition and reference year before comparing figures.